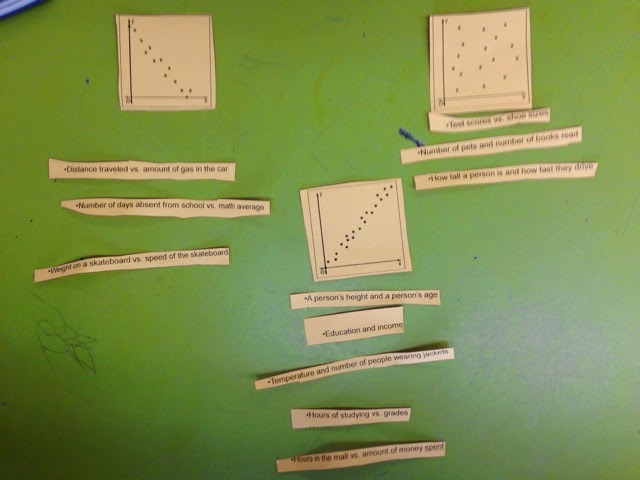
Today I tried this fun sorting activity for scatter plots: http://everybodyisageniusblog.blogspot.com/2012/08/scatter-plots-correlation.html?showComment=1395967903398&m=1 (PDF available for free)
When students have a graph to look at, they can easily see the correlation, but it's difficult when they only have the scenarios. We did a few examples together first and I helped them with the language. We talked about temperature vs sales of hot chocolate, ice cream, and ID badges (negative, positive, and no relationship). I made sure to model for them how to talk through these problems. There was some discussion about a few of them- the skaterboarders had a lot to say about the skating one. One student argued the jacket one was no relationship because students at our school wear jackets regardless of the weather to cover their uniforms. I love when students challenge answers and justify their ideas with reasoning - My students always amaze me!
Here is one students' ideas.
Then students used their phones to take pictures of their answers so they could easily compare them to their peers.


A scatter plot called a scatter chart or scatter graph is a simple yet powerful data visualization tool that compares two data sets to find a relationship between them.
ReplyDeleteRead More: https://blog.zumvu.com/scatter-plot-for-data-visualization
I am not sure where you’re getting your information, but great topic.
ReplyDeleteI needs to spend some time learning more or understanding
more. Thanks for fantastic info I was looking for this info for my mission.텍사스홀덤사이트
Scatter plots are a great way to visualize data trends clearly. If you’re ever looking to explain complex concepts or data in written form, ghostwriting services can help present your insights effectively. They can turn technical topics into engaging, readable content!
ReplyDelete